Oprela Manufacturing for Plant Owners: Where Money, Time, and Risks Lie
What owners and directors gain from the system: real cost of each order, workshop load, reasons for delays, employee productivity, and decisions based on facts, not feelings.
A manufacturing owner usually has three questions that are difficult to get an honest answer to: how much did we actually earn on this order, will we meet the deadline, and where are we losing money. The answers are scattered between the manager's spreadsheet, the foreman's head, and accounting, which closes the month a week after it ends.
Oprela Manufacturing gathers these answers in one place and updates them in real time.
How much did we earn
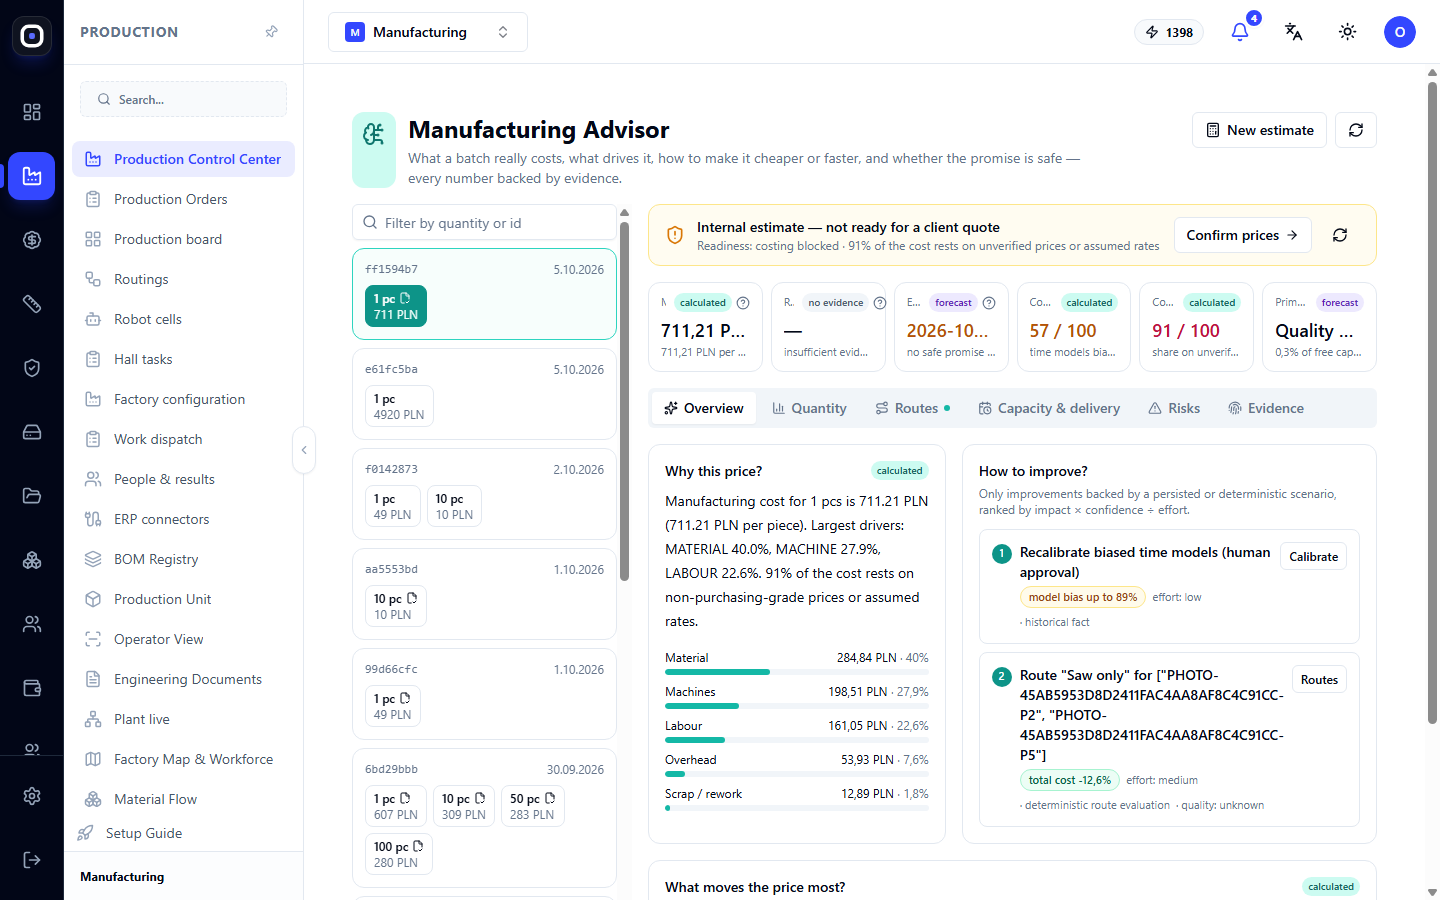
Manufacturing Advisor breaks down the cost of each estimate into material, machine work, labor, and overhead. You see what exactly makes a product expensive, how the price per unit changes depending on quantity, and what alternative routes can make it cheaper.
After an order is completed, actual data from the workshop is compared with the estimate. The system learns from discrepancies: if welding on your products systematically takes longer than estimated, subsequent estimates will be more accurate.
Will we meet the deadline
The Production Board shows all orders together: stages, deadlines, Gantt chart, and personnel load. At the top is a list of "what to do now": which orders are blocked and why.
Before promising a deadline to a client, you can check how a new order will affect the workload. This is the difference between "we'll do it in two weeks, probably" and "we'll do it by the 14th because the welding section is free from the 9th."
What's happening right now
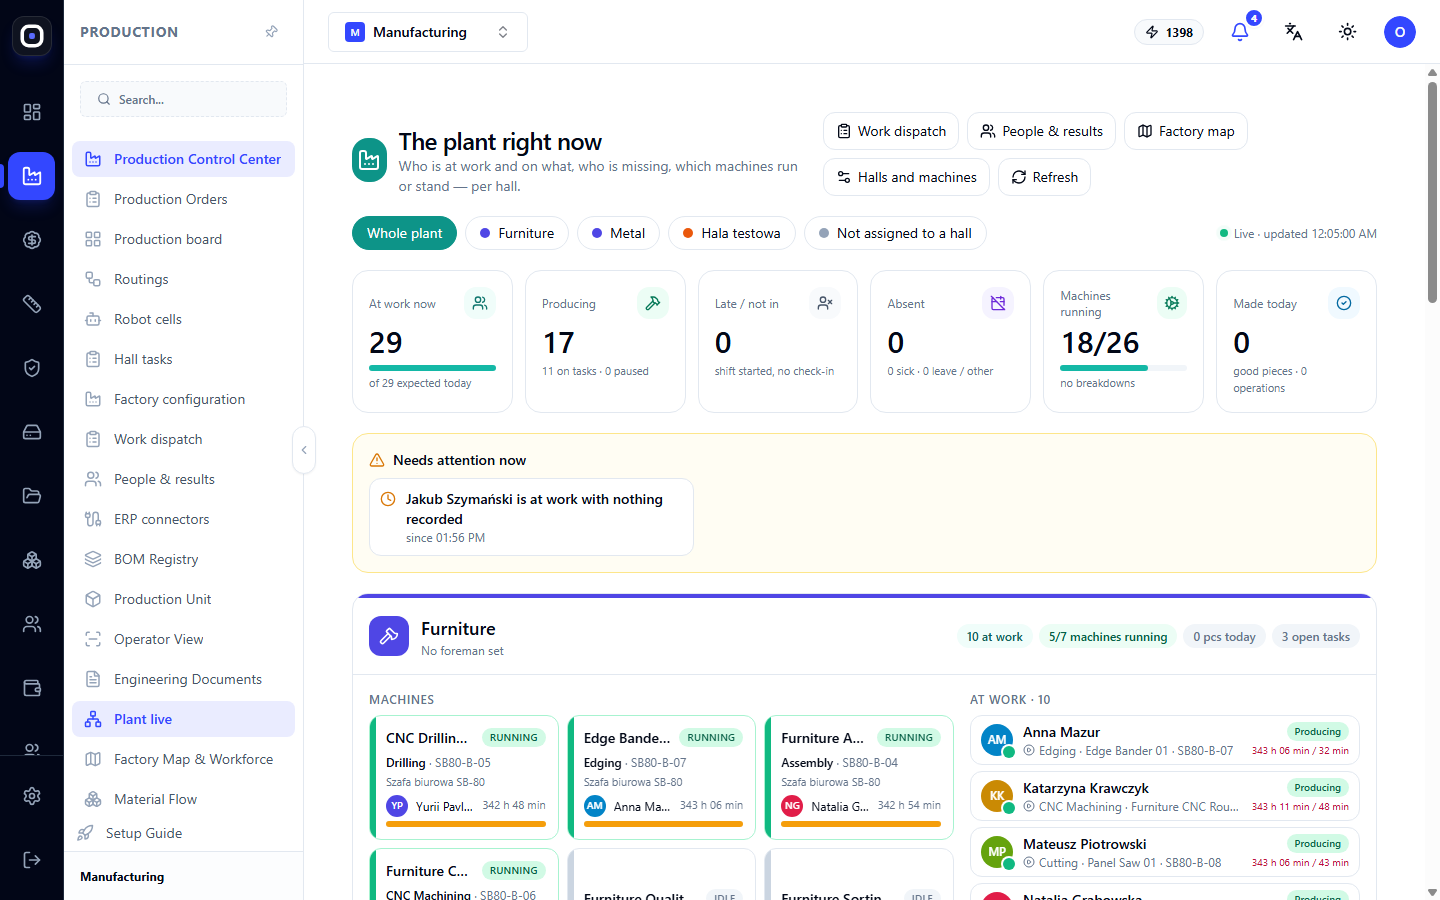
Live Plant shows who is at work, which machines are running and which are idle, and what needs attention: an employee on shift without a task, a machine without an operator, a delay in an operation. You don't need to go to the workshop for this.
Where we are losing
- Reasons for delays. When an operation is delayed, the employee chooses a reason: no material, waiting for drawings, breakdown, rework. After a month, you see not "everything is delayed," but "40% of delays are due to material."
- Defects and reworks. Quality management records every defect, decision, and cost of scrap.
- Downtime. Machine and human idle time is visible by section.
People and results
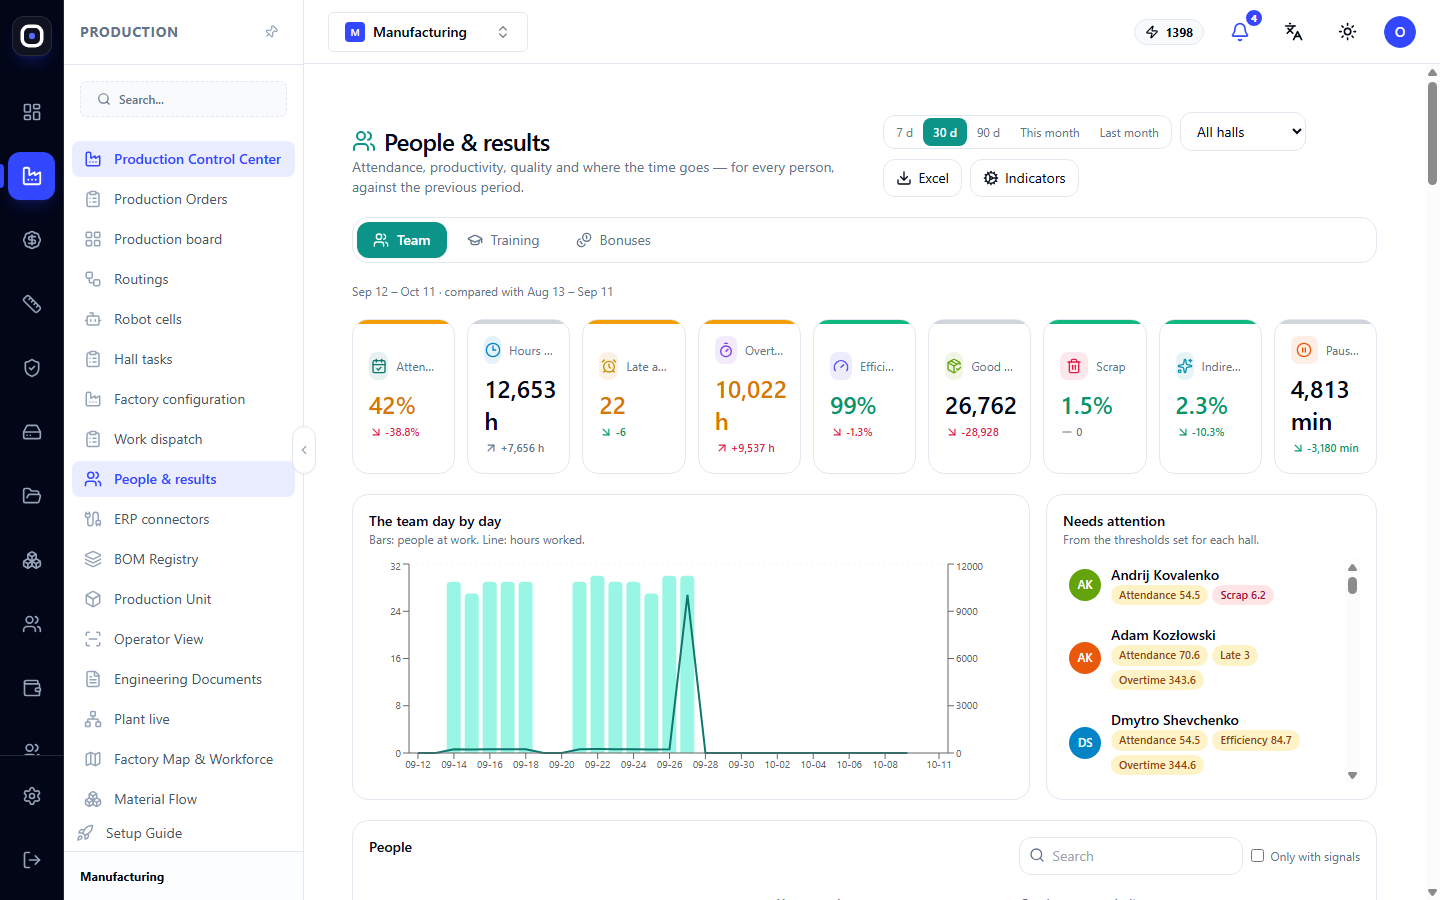
The People and Results page shows attendance, productivity, overtime, quality, and training plan — compared to the previous period. "Needs Attention" signals suggest who to talk to. Bonus calculations are based on actual data, not impressions.
Independence from specific individuals
The biggest risk for a small plant is knowledge residing in the heads of one or two people. When routes, norms, prices, and rules are described in the system, a new manager calculates the price the same way an experienced one does, and a new foreman sees the same picture as the previous one.
What you will get in the first months
- First month: all orders in one system, visible what, where, and who is doing what.
- Second-third: first comparisons of estimate with actuals, clear reasons for delays.
- Later: more accurate prices, shorter response times to clients, decisions on equipment investments based on real workload.